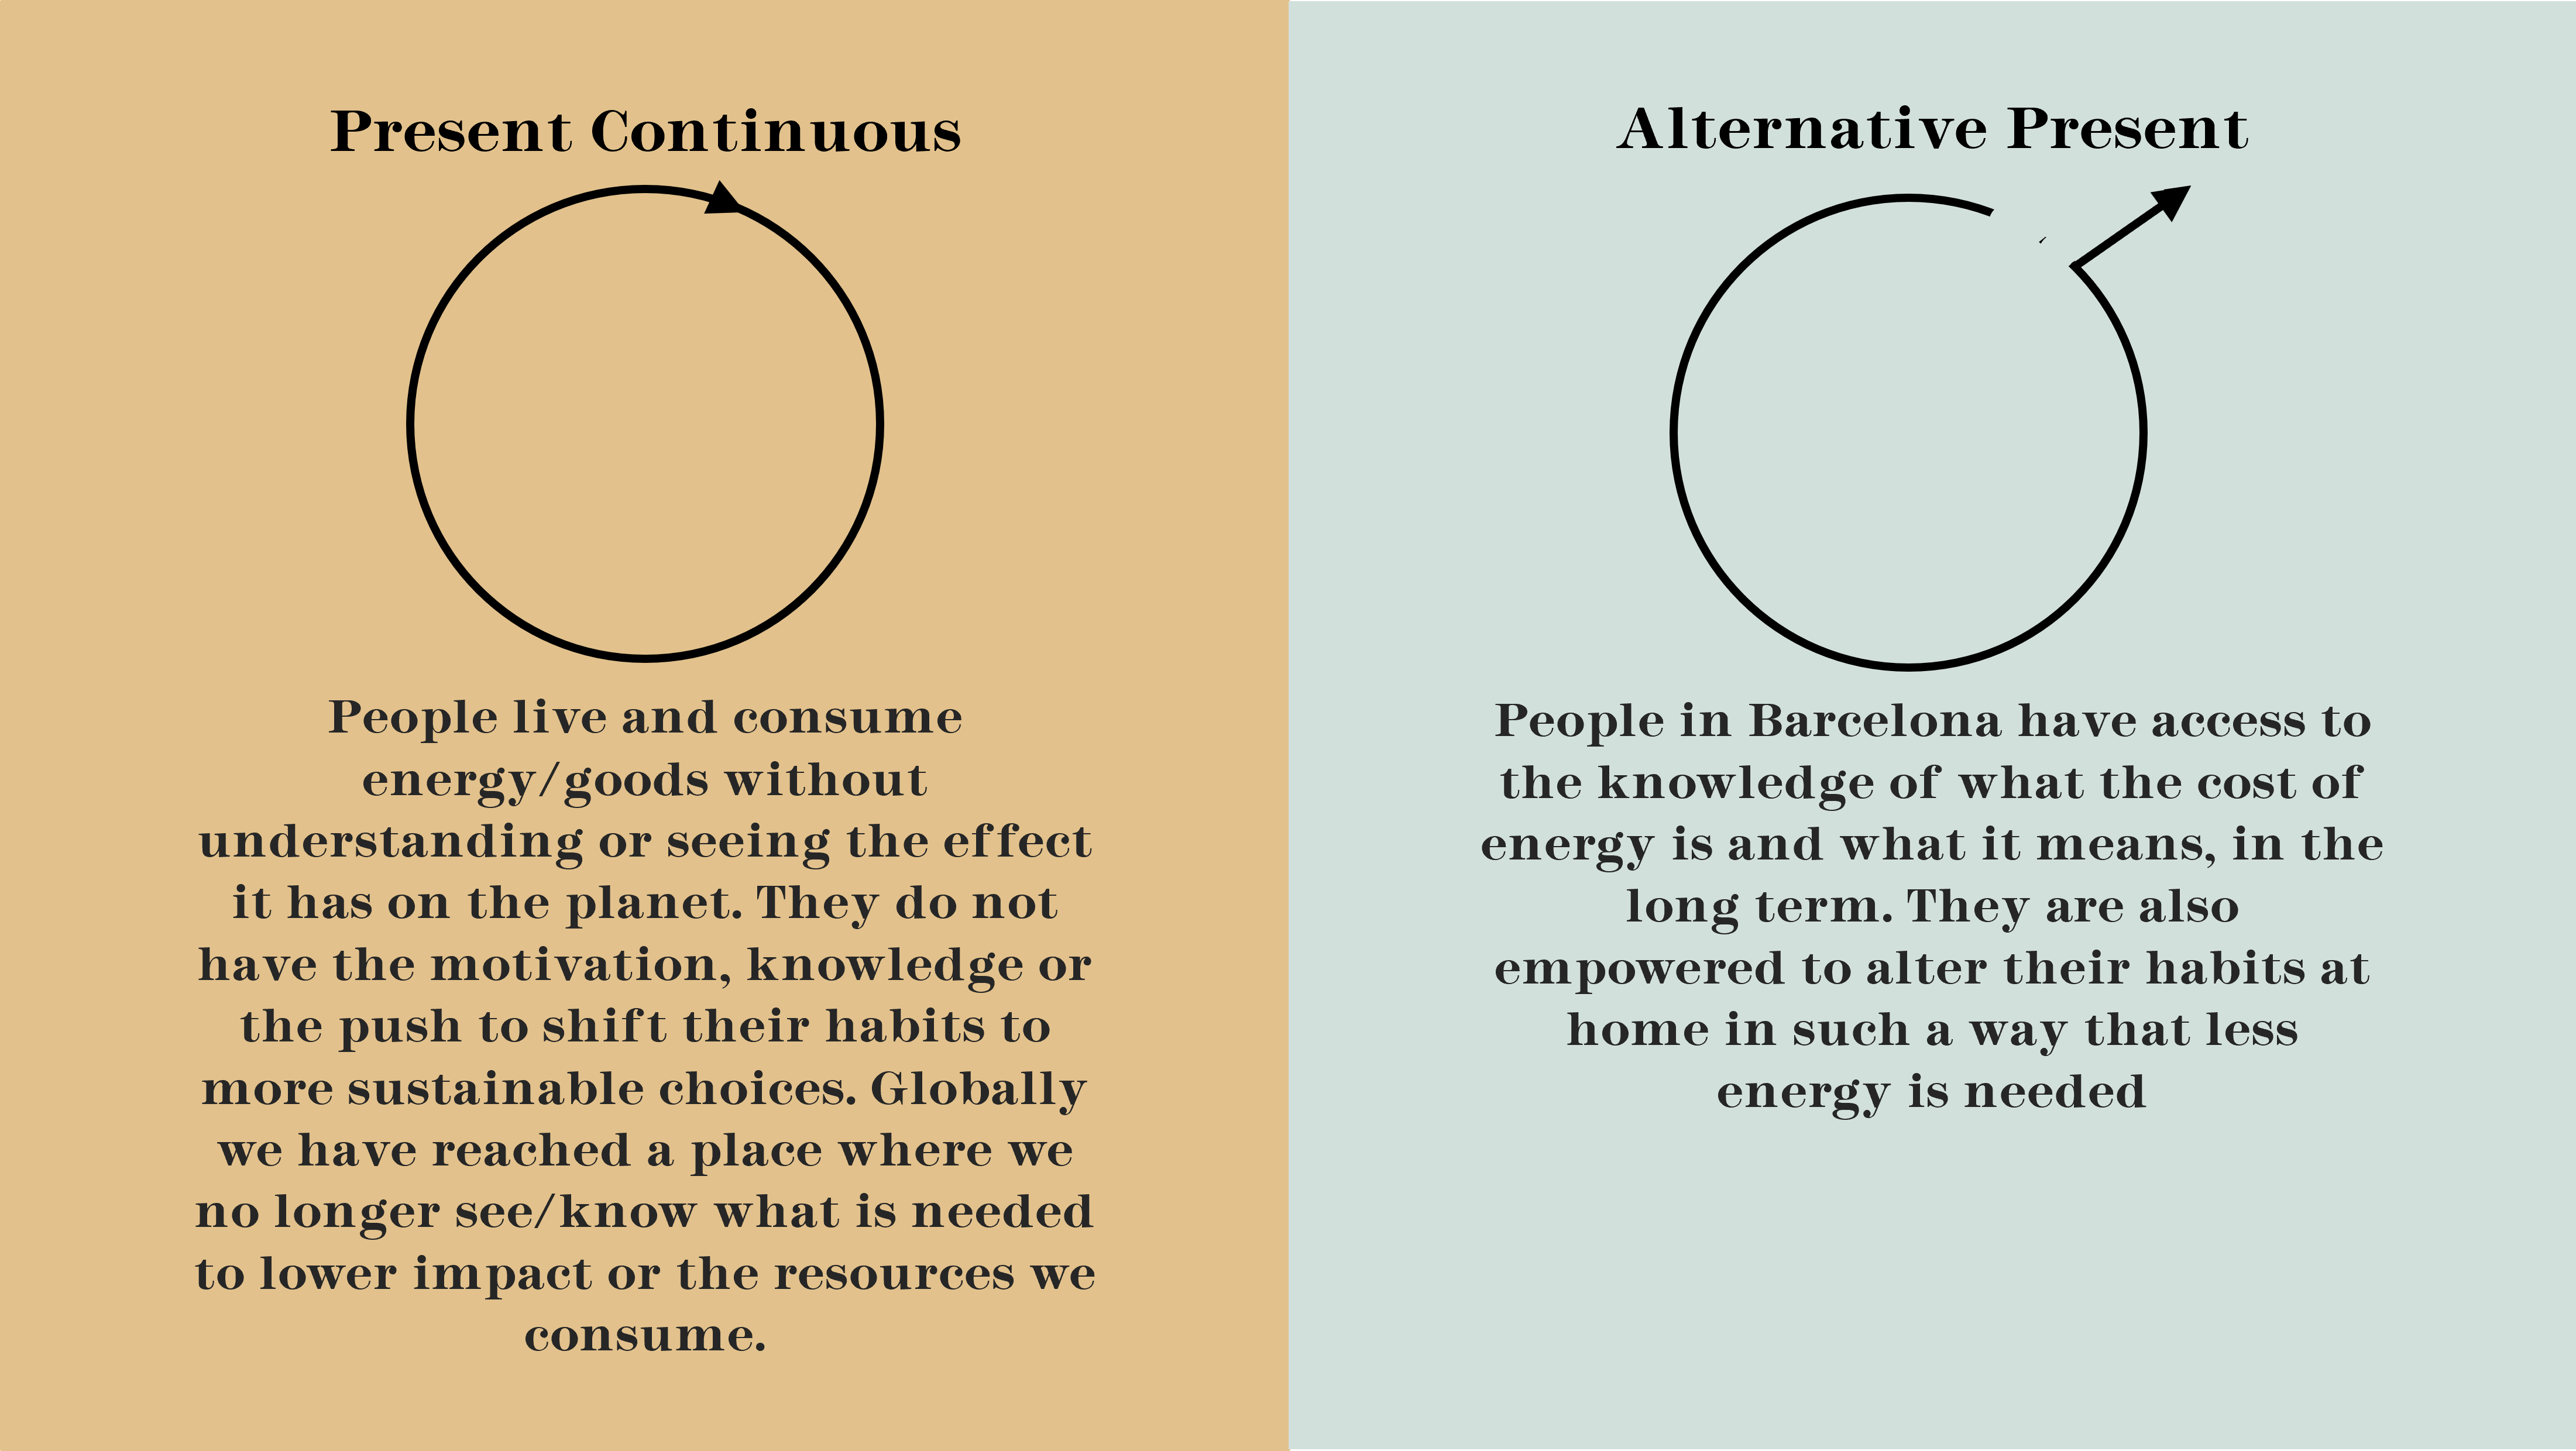
While talking with Oliver about his areas of interest and what he sees for the future of this master and problem areas, we noticed that we had a lot of overlap in ideas, wants and problems. The more we talked the more we realized that the idea we wanted to tackles was almost the same and that we could accomplish a lot more together then apart. That is what for the first couple of interventions at least we are aiming to research, design and reach out to various communities together. It was a bit hard finding the exact place to start within the large scale topic of energy and usage but the start was made by having an open conversation and outlining potential intervention ideas and areas of interest to understand.
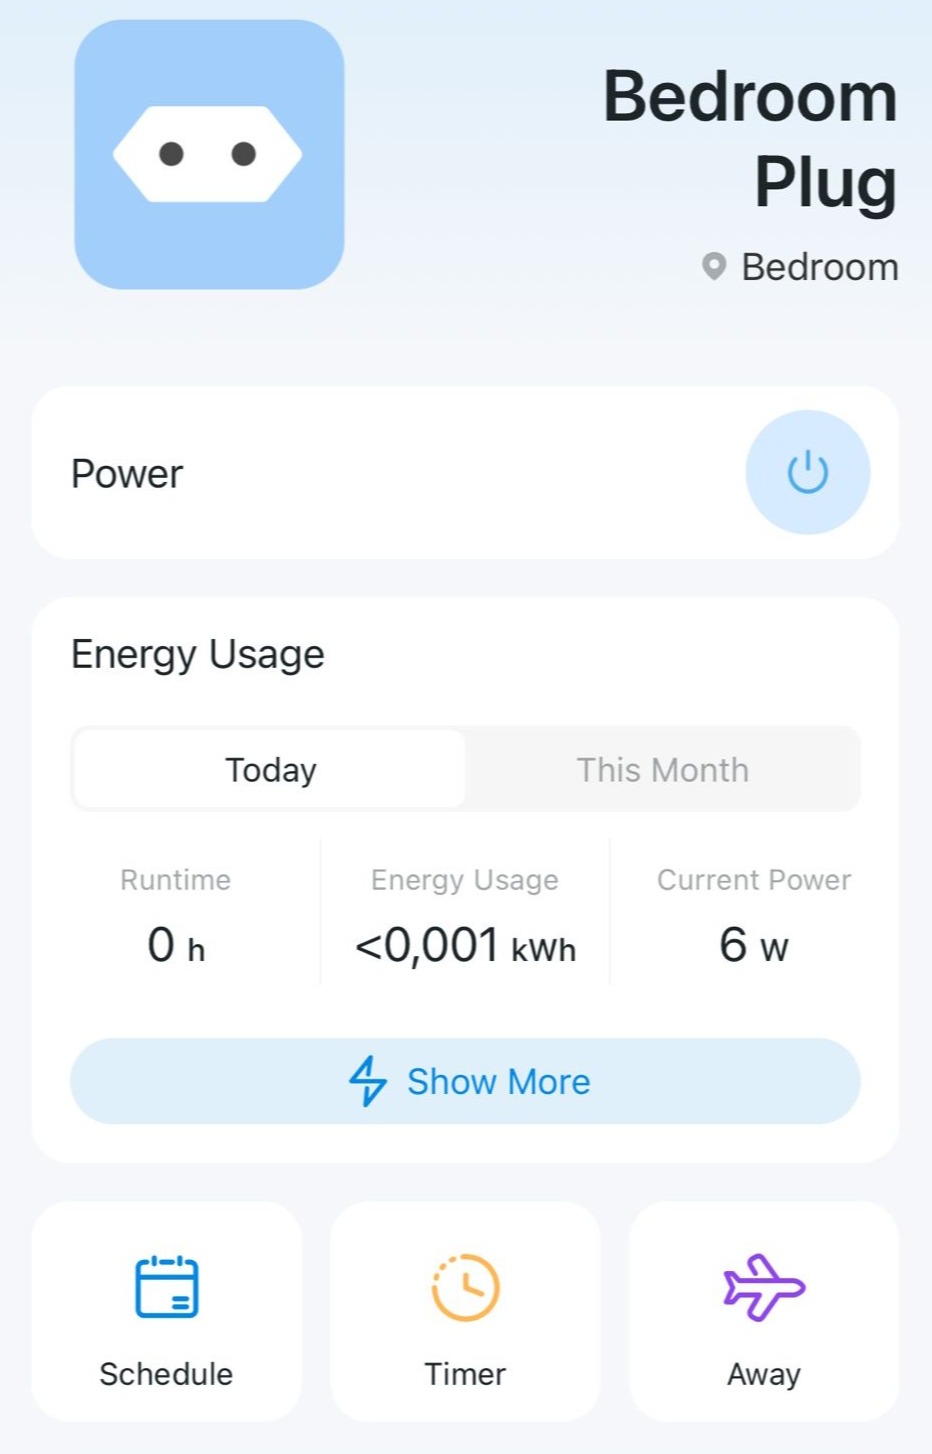
Tapo Energy App
With researching and creating intervention I felt that I wanted to deliver quality results and not rush the process to keep to the deadlines of website updates. Oliver agreed with this and therefore we opted to start our first intervention, however keep it running for a few weeks to get a better understanding of how using smart products in daily life could create a shift in habits. The main goal of the experiment was to get a first person perspective of what it means to use the existing devices to measure energy usage. I felt that this was important in that you cannot design for a problem and market without getting a deeper understanding of what exists already and why the current solutions do not create the change we desire. We bought Tapo Energy Plugs with this in mind. Already after only having used them for a few days there already a few points that stand out to me. The first is that while it does shows you all the data it is presented in a very analytical way. This for me makes it unpersonal and not fun to check. Furthermore, the data given is given in a way that is not tangible for many. It raises the question to me if someone with no knowledge of what energy is could understand such a product. It does have a function to convert it to a price yet that is only a small part.
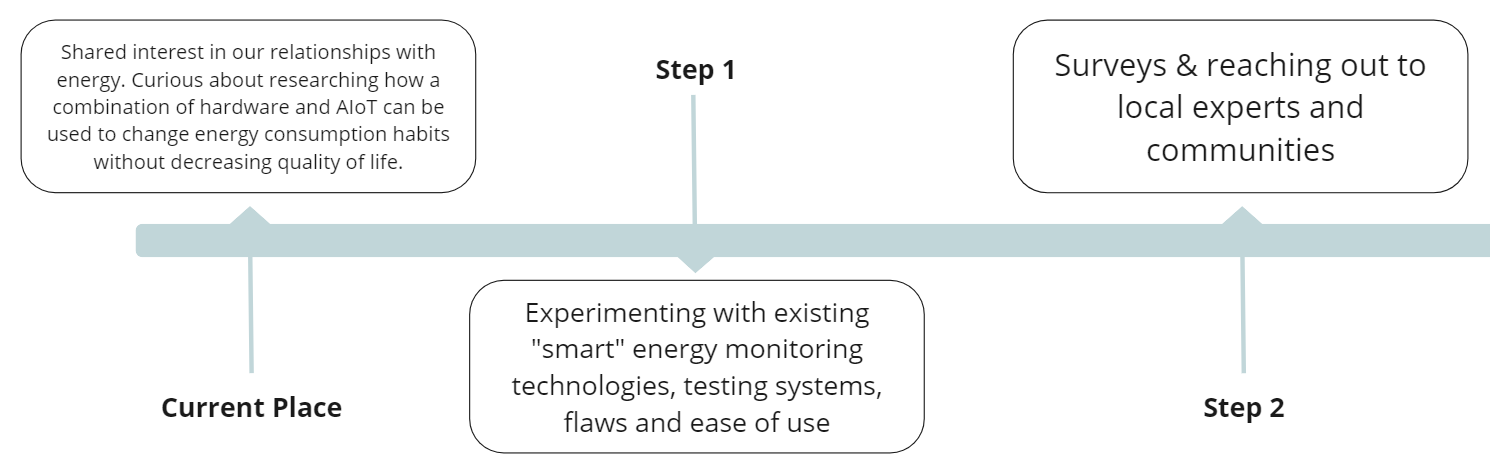
While the intervention has started it is far from over and I feel the following steps of this intervention will be the most impactful for our future research. The first thing we aim to do is continue to track our habits using the app and then try and understand in what ways we could lower our impact. I am curious to see if this device will motivate or create new habits and furthermore what ways it can stimulate this change. There are features that you can use to limit your consumption and I am curious to see how this could impact daily quality of life. This is one main question Oliver and I are interested in. Till which limit could an AI/Algorithm take control before it has an adverse effect on the user. Throughout the coming week we will continue to update each other and this website about the process of this intervention. Furthermore we are aiming to get a better understanding of what other people find about these existing solutions. We want to better understand what communities find the problem within energy management and usage. This we aim to do by reaching out to professionals and interviewing them and also collecting a larger amount of data from different groups through either a survey or another method. With this technique we also hope to create a database to fall back on potentially at a later stage of research.
We then decided to further explore the idea of the 2,000 Watt Society, and how we could try and reduce our energy consumption as much as possible to get closer towards, at or below 2,000 watts of energy usage a day for a week. To do this, we realized we needed to build a comprehensive spreadsheet tracker of all our energy consumption.
Consumption chart 1
Consumption chart 2
Two of my energy consumption graphs, so far it's the home that's taking up the most energy so far!
This so far has proved to be incredibly useful and very eye-opening. We’ve discovered that both of us, use about 8,000 watts of electricity a day (which is about the average that most people in Europe use) as watts of energy consumption isn’t just the electricity we use, but it’s also the energy used in transport and what goes into producing all the food that we eat.
Watts of energy consumption isn’t just the electricity we use, but it’s also the energy used in transport and what goes into producing all the food that we eat.
We’ve discovered a lot of things that require us to do so much more work than we expected to measure our total energy consumption. As it currently stands, trying to monitor all the energy you consume in a day is a complete headache, and if there aren’t easier ways to do it, we’ll likely continue as we are.
The spreadsheet has a few different sheets, a home view where your total consumption is displayed, a sheet for the home and all it’s appliances, transport and food. Each one is split into several columns for categories such as wattage, consumption, time used, grams eaten etc. You can edit the columns for wattage per hour if you know it for your particular appliance, mode of transport or food, and if you don’t there are pre-set values based off of averages to keep you covered. Then as you go about your day, you fill in the usage column with how long you’ve been using that particular item, or how many grams of a particular food you’ve eaten. The total energy consumption for each item is automatically updated to reflect these changes and logged on a pie chart on the home page to make it easy to understand. Each night, the pie charts are saved to a location of your choosing through a custom script, allowing you to have a tangible record of your total energy consumption every day. Then in the morning you reset the usage column of each category and begin again.
If you are interested in checking out the spreadsheet for yourself, and the scripts we’ve created to log data every night, you can check it out by clicking the button below, if you find it useful, or if you have suggestions please get in contact with us.

HTML Creator